Hyperalignment and the INT model#
To analyze fMRI data from multiple brains—including both their commonalities and differences—it is essential to establish functional correspondence across individuals. Hyperalignment [Haxby et al., 2020] is a functional alignment method that establishes such correspondence, based on either brain responses to the same stimuli [Guntupalli et al., 2016, Haxby et al., 2011] or on functional connectivity profiles [Guntupalli et al., 2018]. The Individualized Neural Tuning (INT) model [Feilong et al., 2023] builds upon hyperalignment to model individualized brain functional organization based on a shared template.
Procrustes hyperalignment#
Procrustes hyperalignment [Haxby et al., 2011] is based on the solution to the orthogonal Procrustes problem. It finds a high-dimensional rotation in the feature space to align the brain responses of different individuals into a common space while preserving the representational geometry.
General figure explanation
For the two schematic figures below:
The top and bottom rows denote two different individuals.
Left column: The data matrix of their brain responses, which contains brain responses to 3 stimuli (3 rows) measured at 2 vertices (2 columns).
Middle column: The feature space, where each dimension corresponds to a vertex, and each point corresponds to the brain response pattern to a stimulus.
Right column: The representational geometry, which characterizes the relationships between different stimuli based on the similarities between their response patterns.
The blue and orange triangles denote the response patterns in the two individuals, respectively. The gray triangle denotes the common space, which is the template for the alignment.

Fig 1. Schematic illustration of Procrustes hyperalignment. With a high-dimensional rotation in the feature space (middle), the response patterns of different individuals (left) are aligned into a common space. The representational geometry (right) is preserved in this process.
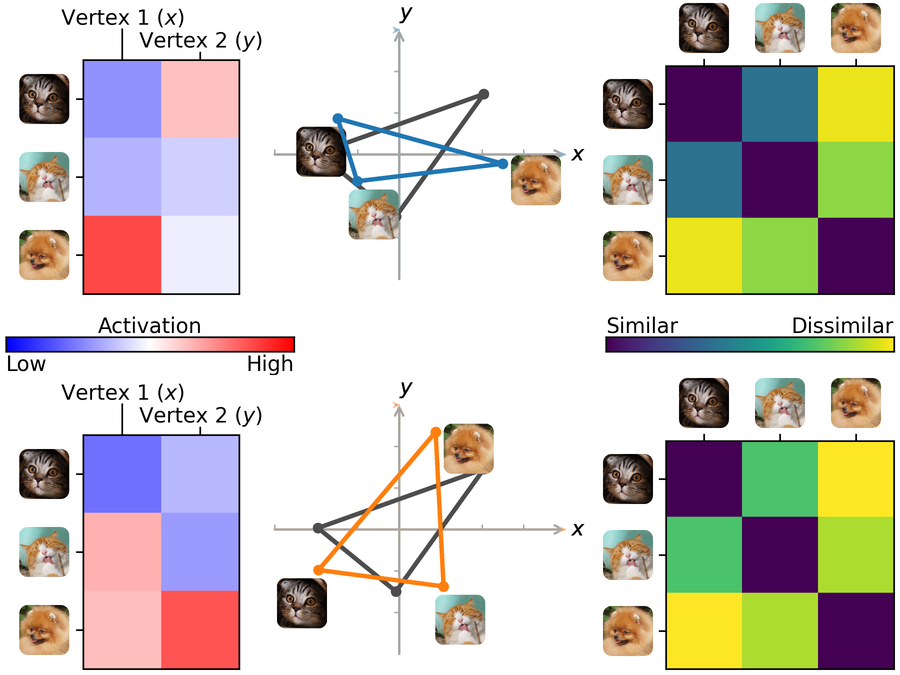
Fig 1. Schematic illustration of Procrustes hyperalignment. With a high-dimensional rotation in the feature space (middle), the response patterns of different individuals (left) are aligned into a common space. The representational geometry (right) is preserved in this process.
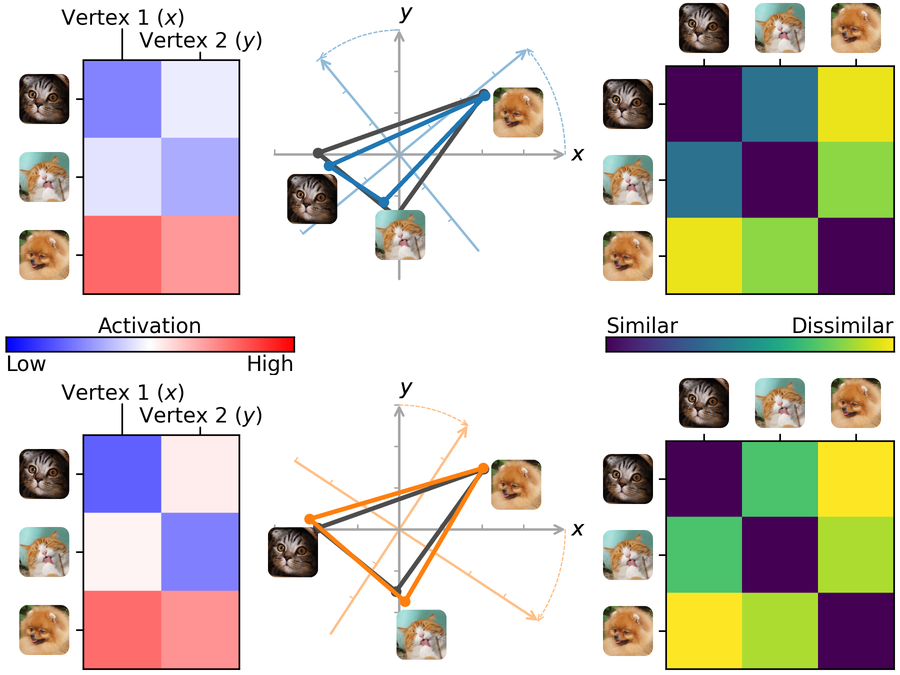
Fig 1. Schematic illustration of Procrustes hyperalignment. With a high-dimensional rotation in the feature space (middle), the response patterns of different individuals (left) are aligned into a common space. The representational geometry (right) is preserved in this process.
Ridge hyperalignment#
Ridge hyperalignment [Feilong et al., 2023] (sometimes referred to as warp hyperalignment) uses ridge regression to learn the functional correspondence across individuals. In addition to rotations or reflections, ridge hyperalignment allows scaling and shearing in the feature space, enabling more flexible alignment. This approach captures both topographic and representational differences across individuals.

Fig 2. Schematic illustration of ridge hyperalignment. The transformation derived using ridge regression is not limited to orthogonal transformations (rotations and reflections) but can also include scaling and shearing in the feature space. These additional degrees of freedom allow ridge hyperalignment to account for both topographic and representational differences across individuals.

Fig 2. Schematic illustration of ridge hyperalignment. The transformation derived using ridge regression is not limited to orthogonal transformations (rotations and reflections) but can also include scaling and shearing in the feature space. These additional degrees of freedom allow ridge hyperalignment to account for both topographic and representational differences across individuals.
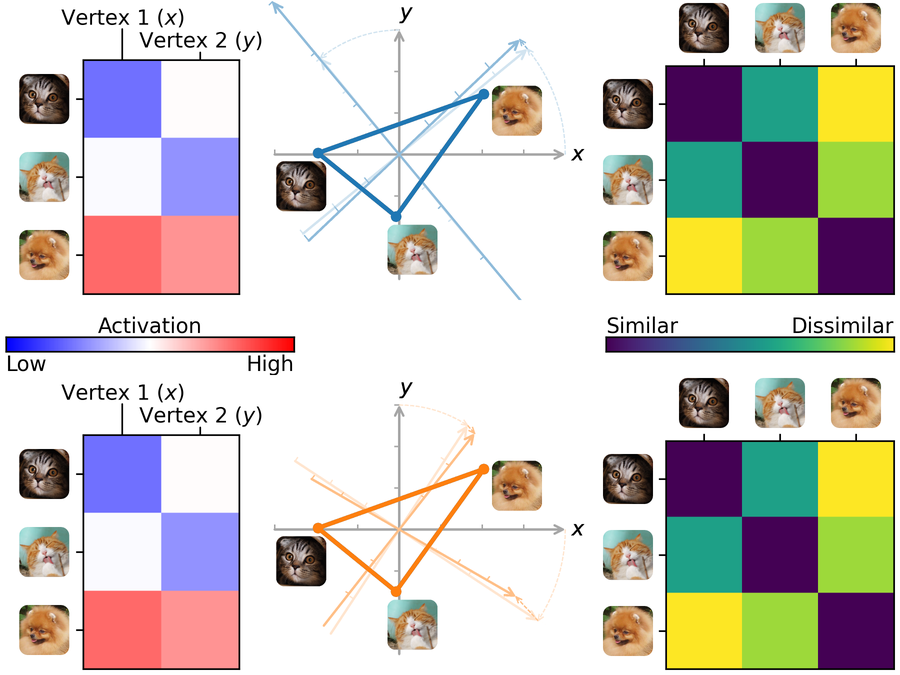
Fig 2. Schematic illustration of ridge hyperalignment. The transformation derived using ridge regression is not limited to orthogonal transformations (rotations and reflections) but can also include scaling and shearing in the feature space. These additional degrees of freedom allow ridge hyperalignment to account for both topographic and representational differences across individuals.
Individualized Neural Tuning (INT) model#
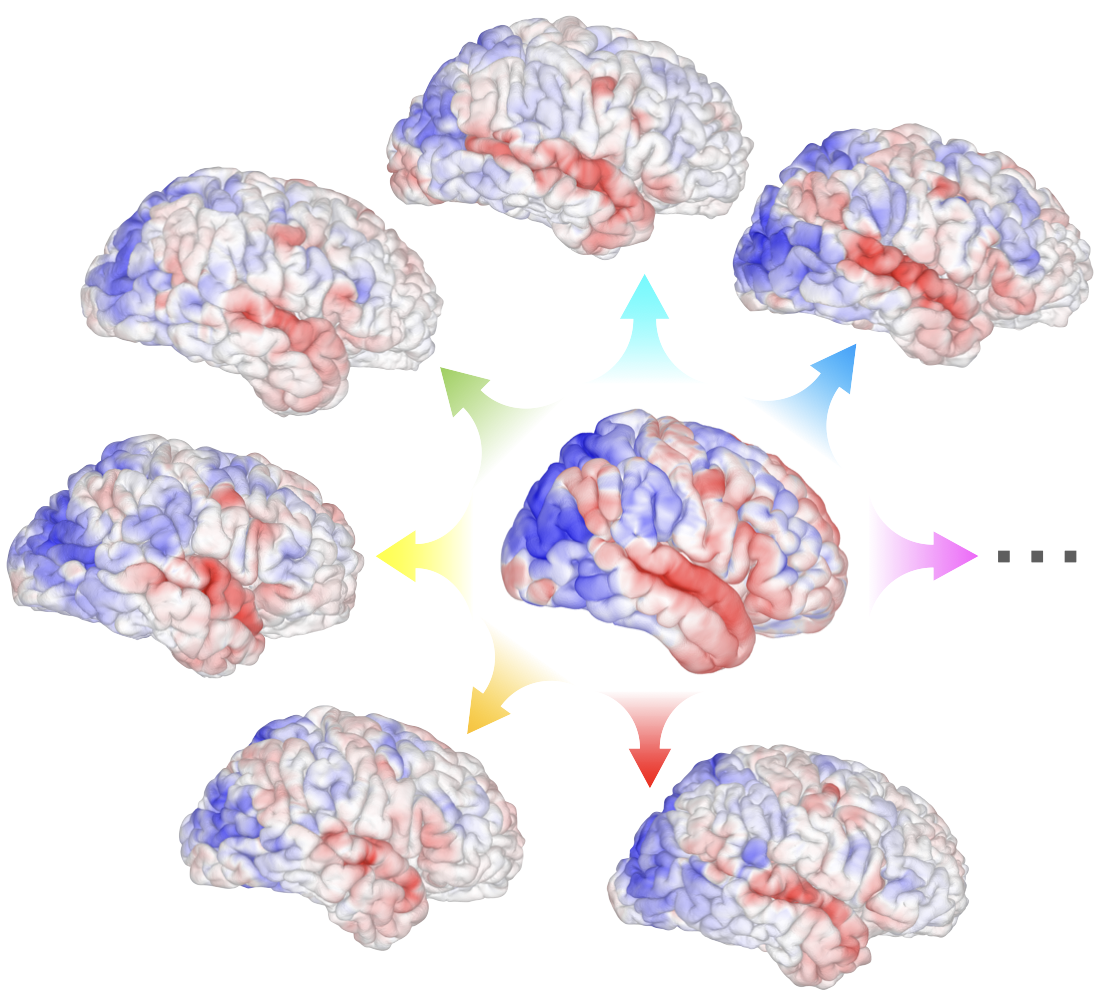
Fig 3. Schematic illustration of the Individualized Neural Tuning (INT) model. In the INT model, the brain responses of each individual are modeled as an individualized transformation of a shared template. See Feilong et al. [2023] for details.
References#
James V Haxby, J Swaroop Guntupalli, Samuel A Nastase, and Ma Feilong. Hyperalignment: modeling shared information encoded in idiosyncratic cortical topographies. elife, 9:e56601, 2020. doi:https://doi.org/10.7554/eLife.56601.
Ma Feilong, Samuel A Nastase, Guo Jiahui, Yaroslav O Halchenko, M Ida Gobbini, and James V Haxby. The individualized neural tuning model: precise and generalizable cartography of functional architecture in individual brains. Imaging Neuroscience, 1:1–34, 2023. doi:https://doi.org/10.1162/imag_a_00032.
J Swaroop Guntupalli, Michael Hanke, Yaroslav O Halchenko, Andrew C Connolly, Peter J Ramadge, and James V Haxby. A model of representational spaces in human cortex. Cerebral cortex, 26(6):2919–2934, 2016. doi:https://doi.org/10.1093/cercor/bhw068.
James V Haxby, J Swaroop Guntupalli, Andrew C Connolly, Yaroslav O Halchenko, Bryan R Conroy, M Ida Gobbini, Michael Hanke, and Peter J Ramadge. A common, high-dimensional model of the representational space in human ventral temporal cortex. Neuron, 72(2):404–416, 2011. doi:https://doi.org/10.1016/j.neuron.2011.08.026.
J Swaroop Guntupalli, Ma Feilong, and James V Haxby. A computational model of shared fine-scale structure in the human connectome. PLoS computational biology, 14(4):e1006120, 2018. doi:https://doi.org/10.1371/journal.pcbi.1006120.